
































Al Jahra climate by month
What the weather is like
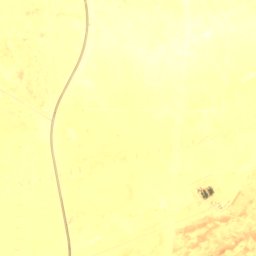
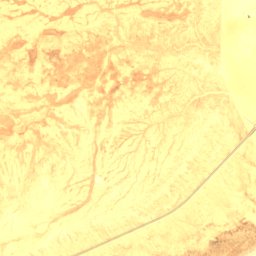
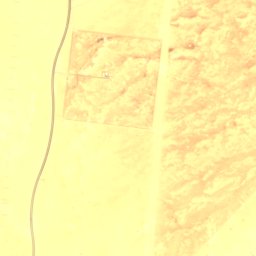
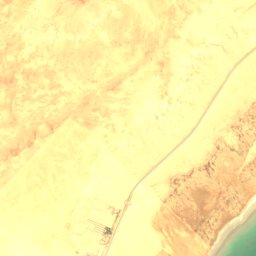
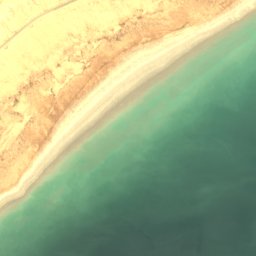
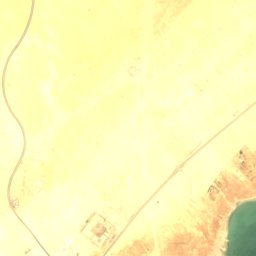
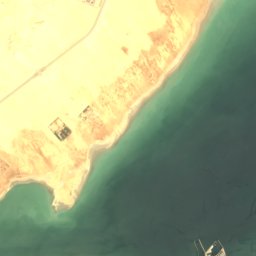
Al Jahra has a hot desert climate (Köppen BWh): very little rain and intense sun.
The warmest month is July, when afternoons average 46° and nights 31°. January is the coolest month, with highs of 17° and lows of 7°. The difference between the warmest and the coolest month is about 27°, a large swing typical of continental interiors.
About 109 mm of precipitation falls in an average year. January is the wettest month (27 mm, 2 wet days) and August the driest (0 mm, 0 wet days). Cloud cover ranges from 1% in June to 24% in December.
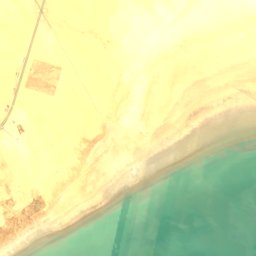
The sea reaches about 32° in August. Sea temperatures lag the air by a month or two, so late summer is usually warmer for swimming than early summer.
Compared with Kuwait City, the capital, Al Jahra is 4.7° warmer on a July afternoon and receives more precipitation over the year.
Year in figures
- Hottest afternoons
- 46° · July
- Coldest nights
- 7° · January
- Wettest month
- January
- Driest month
- August
- Clearest skies
- June · 1% cloud
- Warmest sea
- 32° · August
- Longest day
- 14 h 01 min
- Shortest day
- 10 h 17 min
Twelve months at a glance
Temperature and precipitation
Daily high/low range bars, monthly precipitation columns, sea temperature lineTemperature curve
Average high, low and seaDaylight
Hours between sunrise and sunset on the 15th of each monthClimate normals month by month
| Month | Jan | Feb | Mar | Apr | May | Jun | Jul | Aug | Sep | Oct | Nov | Dec |
|---|---|---|---|---|---|---|---|---|---|---|---|---|
| Average high | 17° | 20° | 26° | 33° | 40° | 44° | 46° | 46° | 42° | 36° | 26° | 19° |
| Average low | 7° | 9° | 13° | 19° | 26° | 29° | 31° | 31° | 27° | 22° | 15° | 9° |
| Precipitation | 27 mm | 13 mm | 16 mm | 11 mm | 2 mm | 0 mm | 0 mm | 0 mm | 0 mm | 2 mm | 20 mm | 18 mm |
| Wet days (≥1 mm) | 1.9 | 1.4 | 0.8 | 1.2 | 0.1 | 0.1 | 0.1 | 0 | 0 | 0.3 | 1.3 | 1.8 |
| Cloud cover | 22% | 17% | 20% | 23% | 15% | 1% | 1% | 1% | 1% | 8% | 19% | 24% |
| Sea temperature | 16° | 16° | 18° | 22° | 26° | 29° | 31° | 32° | 31° | 28° | 24° | 19° |
| Daylight | 10h 28 | 11h 09 | 11h 58 | 12h 52 | 13h 36 | 14h 01 | 13h 51 | 13h 13 | 12h 22 | 11h 30 | 10h 42 | 10h 17 |
| Month score | 91 | 97 | 94 | 63 | 58 | 58 | 58 | 58 | 58 | 57 | 93 | 96 |