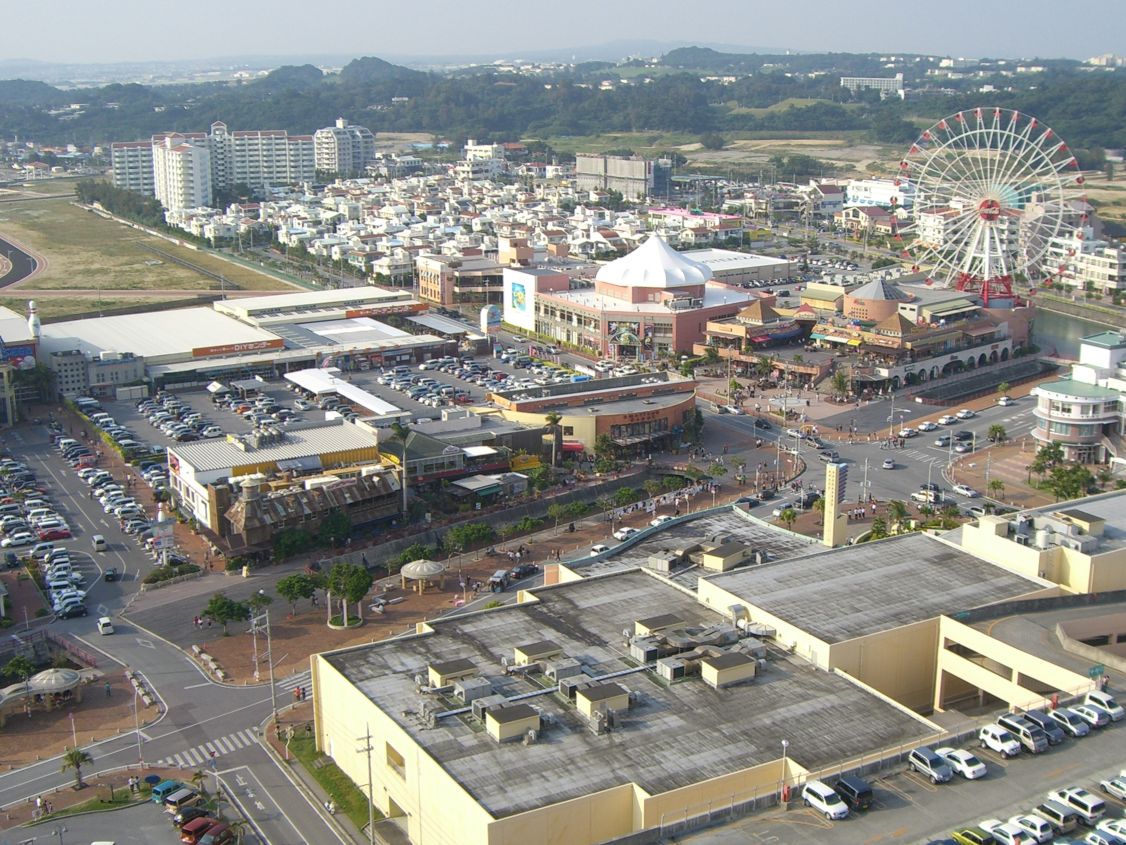
ChatanReport this photo · linked, not stored

Chatan climate by month
What the weather is like
Chatan has a humid subtropical climate (Köppen Cfa): rain spread through the year and no real dry season.
The warmest month is August, when afternoons average 29° and nights 27°. February is the coolest month, with highs of 19° and lows of 17°. The difference between the warmest and the coolest month is about 10°.
About 2,305 mm of precipitation falls in an average year. June is the wettest month (291 mm, 22 wet days) and February the driest (138 mm, 10 wet days). Cloud cover ranges from 32% in October to 55% in June.
The sea reaches about 29° in August. Sea temperatures lag the air by a month or two, so late summer is usually warmer for swimming than early summer.
Compared with Tokyo, the capital, Chatan is 0.9° cooler on a August afternoon and receives more precipitation over the year.
Year in figures
- Hottest afternoons
- 29° · August
- Coldest nights
- 17° · February
- Wettest month
- June
- Driest month
- February
- Clearest skies
- October · 32% cloud
- Warmest sea
- 29° · August
- Longest day
- 13 h 47 min
- Shortest day
- 10 h 30 min
Twelve months at a glance
Temperature and precipitation
Daily high/low range bars, monthly precipitation columns, sea temperature lineTemperature curve
Average high, low and seaDaylight
Hours between sunrise and sunset on the 15th of each monthClimate normals month by month
| Month | Jan | Feb | Mar | Apr | May | Jun | Jul | Aug | Sep | Oct | Nov | Dec |
|---|---|---|---|---|---|---|---|---|---|---|---|---|
| Average high | 19° | 19° | 20° | 22° | 24° | 27° | 28° | 29° | 28° | 26° | 23° | 20° |
| Average low | 17° | 17° | 18° | 20° | 23° | 25° | 27° | 27° | 26° | 24° | 22° | 18° |
| Precipitation | 120 mm | 138 mm | 186 mm | 183 mm | 267 mm | 291 mm | 168 mm | 264 mm | 265 mm | 170 mm | 126 mm | 127 mm |
| Wet days (≥1 mm) | 10 | 9.5 | 12.8 | 13.7 | 21.3 | 21.7 | 19 | 20.5 | 18.2 | 11.7 | 12 | 14.2 |
| Cloud cover | 52% | 54% | 47% | 43% | 49% | 55% | 39% | 36% | 34% | 32% | 41% | 46% |
| Sea temperature | 22° | 22° | 22° | 23° | 25° | 27° | 29° | 29° | 28° | 27° | 25° | 24° |
| Daylight | 10h 40 | 11h 16 | 11h 58 | 12h 46 | 13h 25 | 13h 47 | 13h 38 | 13h 05 | 12h 20 | 11h 34 | 10h 52 | 10h 30 |
| Month score | 67 | 68 | 63 | 62 | 59 | 50 | 49 | 50 | 54 | 68 | 67 | 60 |