
Mulara
Mulara is a locality in Queensland, Australia. It has a population of about 93 (2021). The climate is classified as humid subtropical (Köppen Cfa), with rain spread through the year and no real dry season.
Best: Jun · Aug–Sep. Warmth, sunshine and dry days, month by month.
Mulara at a glance
The months with the highest weather score
Average high in January
Average low in July
120 mm of rain
28 mm of rain
within 38 km
Weather in Mulara
Now and the next ten days. The 14 and 30-day outlooks are one click away.
Cloudy · wind 10 km/h · humidity 75%
When to go to Mulara
Each month's weather score (warmth, sun, dry days) with its temperatures and rain.
| Jan | Feb | Mar | Apr | May | Jun | Jul | Aug | Sep | Oct | Nov | Dec | |
|---|---|---|---|---|---|---|---|---|---|---|---|---|
| Score | 53 | 55 | 57 | 77 | 80 | 89 | 89 | 95 | 92 | 78 | 69 | 57 |
| High | 29° | 29° | 28° | 26° | 24° | 21° | 21° | 22° | 24° | 26° | 28° | 29° |
| Low | 23° | 23° | 22° | 20° | 17° | 14° | 13° | 14° | 17° | 19° | 21° | 23° |
| Rain (mm) | 126 | 169 | 120 | 86 | 75 | 52 | 34 | 32 | 28 | 48 | 80 | 132 |
| Wet days | 13 | 12 | 14 | 8 | 8 | 5 | 5 | 2 | 3 | 7 | 9 | 12 |
What's on in Mulara
Concerts, football matches, the public holidays ahead and the town's festivals through the year.
Monuments and museums in Mulara

Nature around Mulara


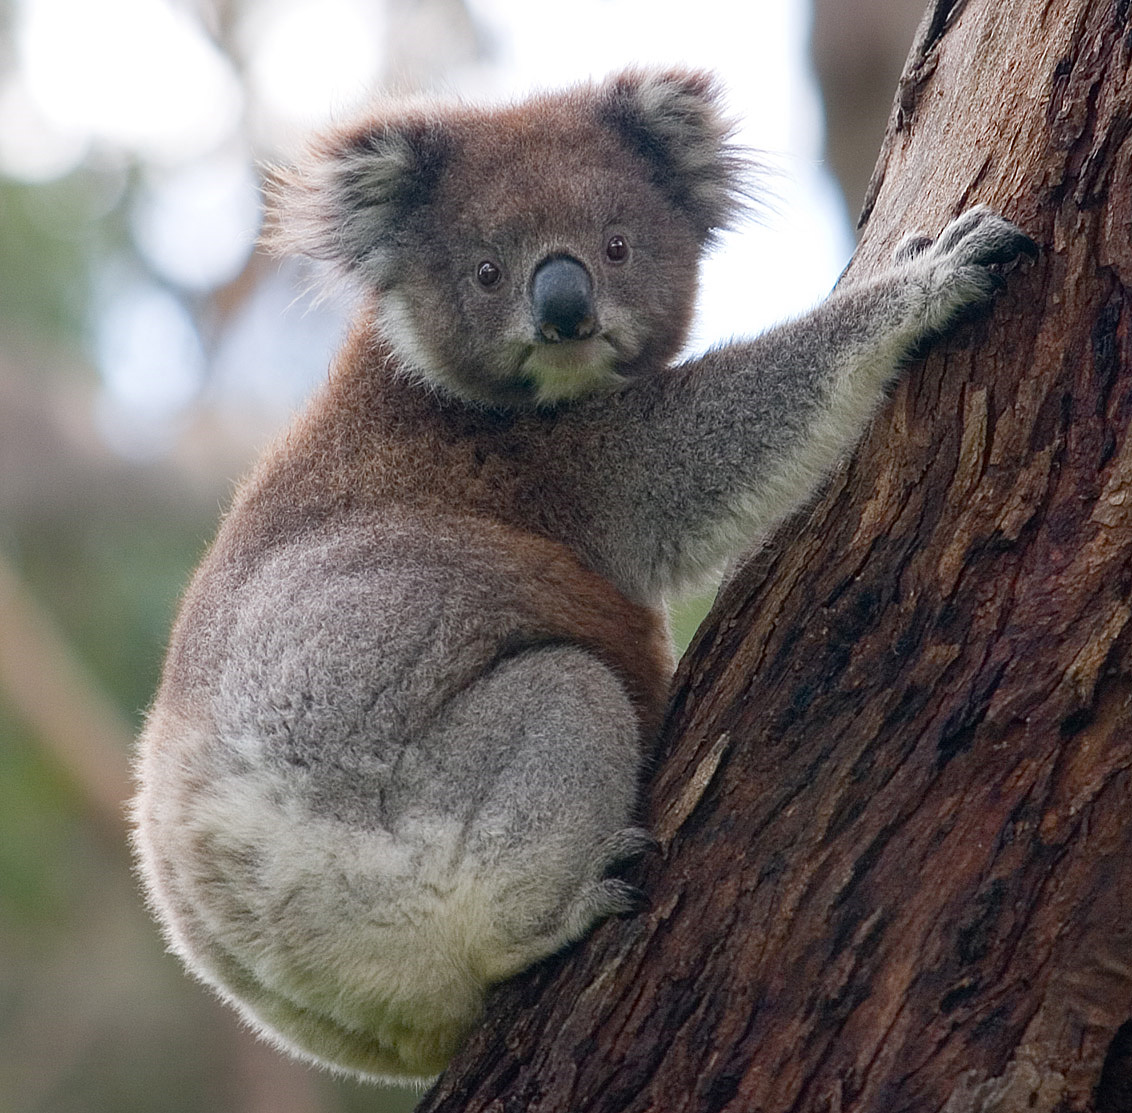
Wildlife in October
The birds and mammals of Australia seen most this month, compared with the rest of their year.



The sky over Mulara
Towns and villages around Mulara
Each with its own page: weather, climate and the best time to visit.


